HTML
Experienced

Hi!
I’m Avennia Maragh (Mirage), a UX-focused data and design professional blending analytical rigor with human-centered design.
I have experience in data analysis, user interface design, and user research. I’m passionate about designing data systems—from databases and algorithms to automation workflows. I hold a Master’s degree in Human-Computer Interaction and User Experience and a Post-Baccalaureate Certificate in Data Science Foundations from Drexel University. I also earned my Bachelor’s degree in Economics from The George Washington University.
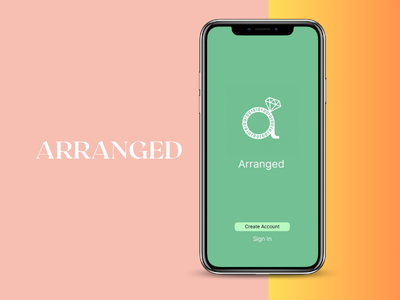
Experienced Experienced Experienced Experienced Experienced Intermediate Intermediate Intermediate Intermediate Intermediate Basic This case study explores the design and development of Arranged, a concept dating app that blends traditional matchmaking with modern AI features. Based on user interviews and market research, I designed a user flow and matching algorithm focused on reducing swipe fatigue, increasing in-person connections, and enhancing safety. Key features include an interactive compatibility scorecard, in-app scheduling, and virtual date options—all designed to move users from match to meeting, faster and more meaningfully.
Application concept focused on optimizing the dining experience. Focuses on ideation, storyboarding, and creation of wireframes to demonstrate user flows.
Design thinking project based on conceptualizing, developing, and prototyping an application meant to "connect people to physical infrastructure".
Utilized Figma to create low-fidelity and high-fidelity prototypes.
Data automation application for handling PDF formatted data for over 2,000+ data points. Utilizes OCR technology and the Python module PDF plumber. The application was designed and prototyped with Figma and then built with PyQt5. SEPTA UI redesign case study. Utilized UseBerry and Figma to leverage user data from A/B testing. Data visualization report for the City of Philadelphia's Building Energy Programs. Created via Python package Plotly and Adobe InDesign. Heuristic evaluation of the popular food delivery platform UberEats, in comparison to its competitors. Utilizied Tableau desktop and a public data set on the summer olympics to generate a data visualization report for key insights. SKILLS
![]()
HTML
![]()
Python
![]()
Figma
![]()
Adobe
![]()
Excel
![]()
RStudio
![]()
CSS
![]()
Git

SQL

Tableau
![]()
Sketch
![]()
JavaScript

Alteryx
![]()
Neo4J

Linkurious
PROJECTS
Product Development

Product Development

Product Development

Product Development

UI Design

Data Visualization

UX Research

Data Visualization
CONTACT